Household Prix de l'électricité en Europe (2026)
European households paid an average of €0.2832 per kWh for electricity in the first half of 2026, per Eurostat — but the spread is enormous: from €0.1139 in Hongrie to €0.3871 in Irlande. EnergyPrices Europe tracks the all-in price, standing charges, typical bills et the generation mix behind them, for all 27 EU members plus the Royaume-Uni, Norvège et Suisse.
Par l'équipe éditoriale d'EnergyPrices Europe · Mis à jour en novembre 2026
Chiffres clés en bref
| European household electricity | Price per kWh (taxes incl.) | Facture annuelle à 3,500 kWh |
|---|---|---|
| EU-27 average, first half of 2026 | €0.2832 | €991 |
Per Eurostat — Statistiques des prix de l'électricité, first half of 2026 (band DC, 2,500–5,000 kWh/year). Highest: Irlande €0.3871. Lowest: Hongrie €0.1139.
Electricity prices by country
Every guide follows the same structure: the verified per-kWh price, what the price is made of, standing charges, typical annual bills at several consumption levels, the energy mix that drives the wholesale cost, et how to cut your bill. Start with your country:
Irlande
€0.3871/kWh (Eurostat H1 2026) — EU's most expensive household power; gas-exposed island market with world-class wind.
Allemagne
€0.3618/kWh (Eurostat H1 2026) — Second priciest in the EU; 58% renewables, high grid costs et a 34% tax wedge.
Belgique
€0.3575/kWh (Eurostat H1 2026) — Nuclear plus gas with region-heavy system costs; third highest in the EU.
Autriche
€0.3260/kWh (Eurostat H1 2026) — 90.8% renewables — the EU's greenest grid — but alpine network costs push prices up.
Italie
€0.3142/kWh (Eurostat H1 2026) — Hydro, solar et a gas marginal; system charges et 25% tax wedge.
Suède
€0.3062/kWh (Eurostat H1 2026) — Four price zones, hydro et nuclear; the south pays Nordic premium rates.
Pologne
€0.2999/kWh (Eurostat H1 2026) — EU's highest tax wedge (47%) et a grid in transition from coal to solar et wind.
Tchéquie
€0.2884/kWh (Eurostat H1 2026) — 40% nuclear Temelín/Dukovany; prices eased 9% year on year.
Roumanie
€0.2836/kWh (Eurostat H1 2026) — The EU's sharpest increase (+48% sur un an) as price caps wound down in 2025.
Finlande
€0.2694/kWh (Eurostat H1 2026) — Olkiluoto 3's nuclear era; prices rebounded 18% in a wind-hydro market.
Chypre
€0.2688/kWh (Eurostat H1 2026) — Island grid: oil-to-gas generation et rising solar, no interconnectors yet.
Espagne
€0.2509/kWh (Eurostat H1 2026) — Solar superpower at 60.7% renewables; hourly PVPC pricing for regulated users.
France
€0.2485/kWh (Eurostat H1 2026) — 67% nuclear et a regulated tariff keep France 12% below the EU average.
Pays-Bas
€0.2440/kWh (Eurostat H1 2026) — Net-negative effective taxes: the state pays part of household electricity bills.
Lettonie
€0.2415/kWh (Eurostat H1 2026) — Daugava hydro plus Baltic synchronisation with the continental grid in 2025.
Grèce
€0.2401/kWh (Eurostat H1 2026) — 60.9% renewables et colour-coded tariffs make comparing easy.
Danemark
€0.2375/kWh (Eurostat H1 2026) — The EU's biggest price fall (−32% sur un an) in a wind-dominated system.
Portugal
€0.2367/kWh (Eurostat H1 2026) — 65.6% renewables in the MIBEL market shared with Espagne.
Lituanie
€0.2162/kWh (Eurostat H1 2026) — Post-Ignalina wind et solar boom; 59.9% renewables et rising.
Estonie
€0.2118/kWh (Eurostat H1 2026) — Oil shale out, wind in; synced to the continental grid in February 2025.
Slovénie
€0.2118/kWh (Eurostat H1 2026) — Krško nuclear et alpine hydro keep Slovénie 25% below average.
Luxembourg
€0.2023/kWh (Eurostat H1 2026) — Prices fell 24% sur un an — the EU's second-largest drop — as surcharges rolled off.
Slovaquie
€0.1985/kWh (Eurostat H1 2026) — 60.6% nuclear — the EU's second-highest share — with regulated household prices.
Croatie
€0.1816/kWh (Eurostat H1 2026) — Hydro et Krško nuclear; prices rising as crisis caps roll off.
Bulgarie
€0.1341/kWh (Eurostat H1 2026) — Third cheapest in the EU on regulated prices et Kozloduy nuclear.
Malte
€0.1268/kWh (Eurostat H1 2026) — Second cheapest: subsidised tariffs, gas et the Sicily interconnector.
Hongrie
€0.1139/kWh (Eurostat H1 2026) — The EU's cheapest electricity: capped universal tariff since 2013.
The UK
26.32p/kWh (Ofgem cap Q4 2026) — Ofgem's quarterly cap: 26.32p/kWh et a 54.83p daily standing charge.
Norvège
€0.1993/kWh (Eurostat H1 2026) — Near-100% hydro with state support when spot prices spike; Europe's biggest users.
Suisse
~27.7 Rp/kWh (ElCom 2026) — Municipal tariffs, ~60% hydro et ~28% nuclear; median 27.7 Rp/kWh in 2026.
Comparer all 30 European markets
The table below ranks EU members by the all-in household price per Eurostat (2026-S1, band DC, taxes included), with the three non-EU markets we track underneath. Renewables share is per Eurostat renewable energy statistics (2025, provisional); nuclear share per the World Nuclear Association (2024).
| Country | Price per kWh (2026) | vs EU avg €0.2832 | Facture annuelle à 3,500 kWh | Renewables share | Nuclear share |
|---|---|---|---|---|---|
| Irlande | €0.3871 | +37% | €1,355 | 42% | — |
| Allemagne | €0.3618 | +28% | €1,266 | 58% | — |
| Belgique | €0.3575 | +26% | €1,251 | 34% | 40% |
| Autriche | €0.3260 | +15% | €1,141 | 91% | — |
| Italie | €0.3142 | +11% | €1,100 | 44% | — |
| Suède | €0.3062 | +8% | €1,072 | 89% | 29% |
| Pologne | €0.2999 | +6% | €1,050 | 32% | — |
| Tchéquie | €0.2884 | +2% | €1,009 | 19% | 40% |
| Roumanie | €0.2836 | +0% | €993 | 50% | 20% |
| Finlande | €0.2694 | -5% | €943 | 57% | 39% |
| Chypre | €0.2688 | -5% | €941 | 28% | — |
| Espagne | €0.2509 | -11% | €878 | 61% | 20% |
| France | €0.2485 | -12% | €870 | 33% | 67% |
| Pays-Bas | €0.2440 | -14% | €854 | 55% | 3% |
| Lettonie | €0.2415 | -15% | €845 | 58% | — |
| Grèce | €0.2401 | -15% | €840 | 61% | — |
| Danemark | €0.2375 | -16% | €831 | 78% | — |
| Portugal | €0.2367 | -16% | €828 | 66% | — |
| Lituanie | €0.2162 | -24% | €757 | 60% | — |
| Estonie | €0.2118 | -25% | €741 | 41% | — |
| Slovénie | €0.2118 | -25% | €741 | 46% | 35% |
| Luxembourg | €0.2023 | -29% | €708 | 23% | — |
| Slovaquie | €0.1985 | -30% | €695 | 24% | 61% |
| Croatie | €0.1816 | -36% | €636 | 59% | — |
| Bulgarie | €0.1341 | -53% | €469 | 34% | 42% |
| Malte | €0.1268 | -55% | €444 | 11% | — |
| Hongrie | €0.1139 | -60% | €399 | 28% | 47% |
| EU-27 average | €0.2832 | — | €991 | 50% | 23% |
| Royaume-Uni (non-EU) | 26.32p (Ofgem Q4-26) | ≈ +9% | £911 at 2,700 kWh | 53% | 12% |
| Norvège (non-EU) | €0.1993 (2026-S1) | −30% | €698 | >100% | 0% |
| Suisse (non-EU) | ~27.7 Rp (ElCom 2026) | ≈ +2% | CHF ~969 | ~66% incl. hydro | 28% |
EU figures per Eurostat dataset nrg_pc_204 (first half of 2026). UK: Ofgem price cap October–December 2026 (typical 2,700 kWh bill; ≈ +9% is an indicative conversion, verify the current exchange rate). Suisse: ElCom/ELC median basic-supply tariff 2026 (the CHF ~969 figure at 3,500 kWh × 27.7 Rp, roughly parity with the euro). Norvège's renewables share exceeds 100% because generation exceeds domestic consumption in net-export years.
What drives prix de l'électricité en Europe
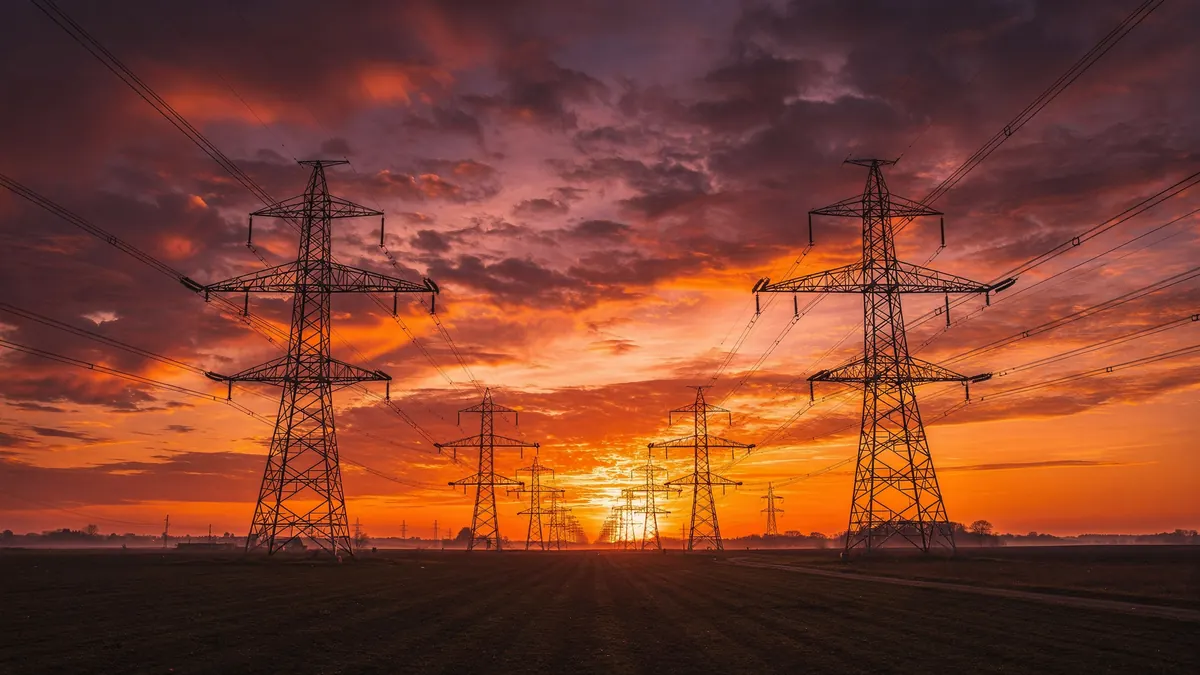
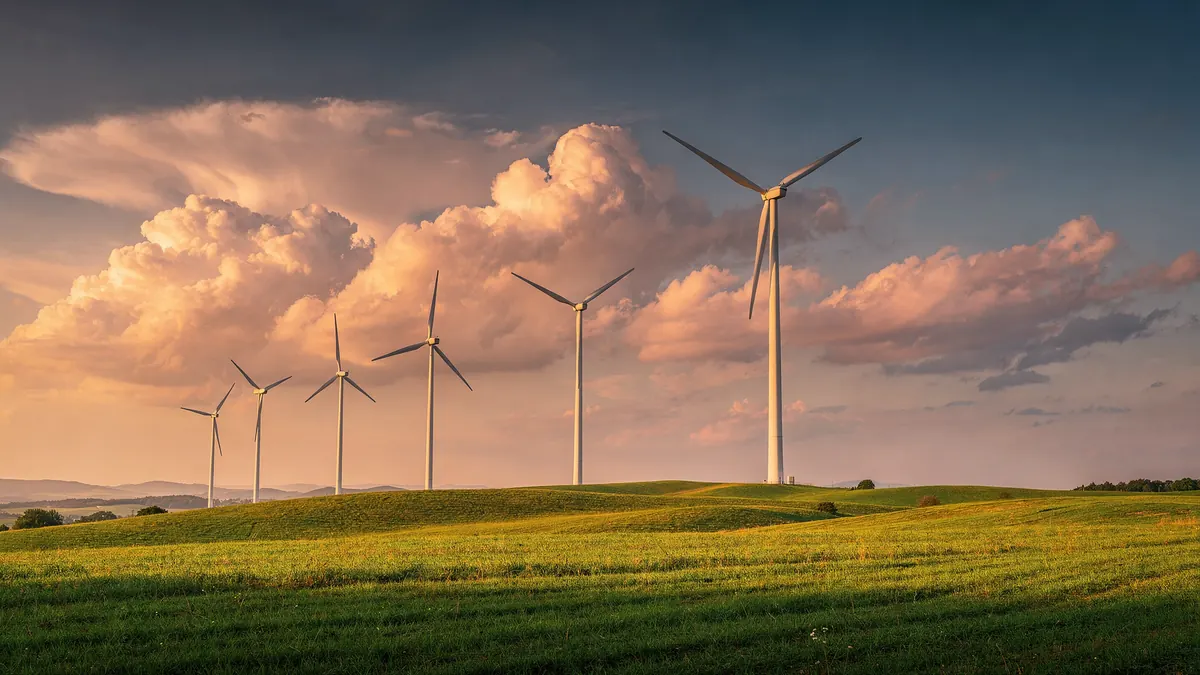
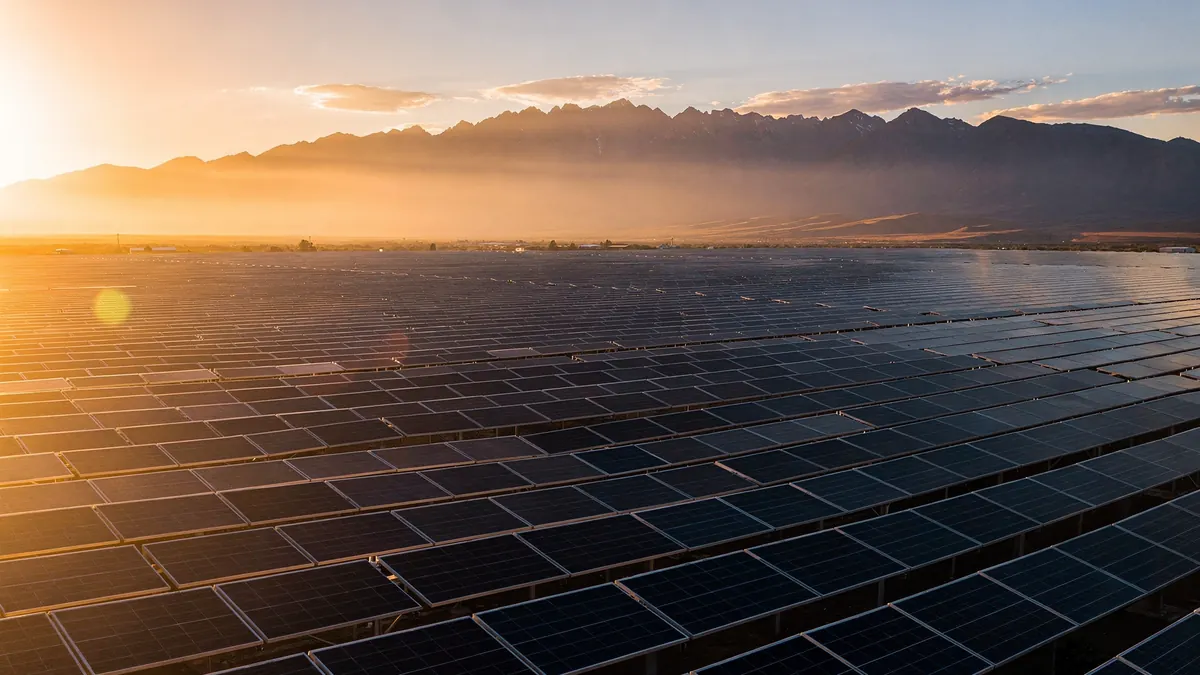
The generation mix sets the floor. Markets with nuclear et hydro baseload — France (67% nuclear), Suède, Norvège (about 88–90% hydro), Slovaquie et Hongrie — insulate their wholesale prices from gas markets. Gas still sets the marginal price across most of the continent, which is why Irlande (gas-dependent, limited interconnection) tops the table while nuclear-heavy France sits in the cheaper half. Renewables covered 49.9% of EU electricity consumption in 2025 (Eurostat, provisional), et every additional sunny or windy hour shaves the day-ahead price — midday solar has pushed German et Spanish prices toward zero at times, with the savings spread through annual averages.
Taxes et network charges do the rest. Across the EU, taxes et levies made up 28.4% of the household price in the first half of 2026, per Eurostat. The wedge ranges from net-negative in the Pays-Bas (−10%, where the energy-tax rebate exceeds VAT et levies) et 6% in Malte to 34% in Allemagne et 47% in Pologne. Network charges — approved by national regulators — recover the cost of grids that must now absorb heat pumps, EVs et rooftop solar simultaneously, et they rise independently of wholesale markets, which is why bills in green grids like Autriche's remain high.
Market design et politics decide who feels the swings. Hongrie's capped universal tariff has not moved meaningfully in three years; Roumanie's cap unwound in 2025 et its price jumped almost half in twelve months; Danemark's levy reforms et cheaper wholesale power cut its price by nearly a third in a year. Spot-linked markets (Norvège, Suède, Estonie, Finlande) pass volatility to households directly, while regulated markets (Slovaquie, Bulgarie, Malte) smooth it away — usually at a fiscal cost someone pays eventually.
Crisis measures have mostly ended. The blanket price caps, VAT cuts et per-kWh subsidies of 2022–2024 are winding down across the continent; what remains is targeted support for vulnerable households. The structural story is electrification: heat pumps et EVs multiply consumption per household, making the per-kWh price — et tariff design — more important every year. Our country pages document each market's numbers et sources in detail.
FAQ
What is the average household electricity price in Europe en 2026 ?
€0.2832 per kWh in the first half of 2026, per Eurostat (dataset nrg_pc_204, band DC — households consuming 2,500–5,000 kWh a year, all taxes et levies included). That is down 2.2% from €0.2896 in the second half of 2025.
Which European country has the most expensive electricity?
Irlande, at €0.3871 per kWh in the first half of 2026 (per Eurostat, taxes included) — 37% above the EU average. Allemagne (€0.3618) et Belgique (€0.3575) follow. Outside the EU, the UK's capped 26.32p per kWh (about €0.31) also sits above the EU average.
Which European country has the cheapest electricity?
Hongrie, at €0.1139 per kWh in the first half of 2026 (per Eurostat) — 60% below the EU average — thanks to a capped universal tariff in place since 2013. Malte (€0.1268) et Bulgarie (€0.1341) complete the bottom three.
Why do electricity prices differ so much between European countries?
Four factors: the generation mix (nuclear et hydro-heavy markets like France et Norvège insulate bills from gas prices), taxes et levies (from −10% of the price in the Pays-Bas to 47% in Pologne, per Eurostat 2026-S1), market design (regulated tariffs in Hongrie or Slovaquie versus spot-exposed markets like Norvège), et interconnection — isolated grids like Irlande et Chypre pay a premium.
What does the Eurostat household price include?
Everything a household pays per kWh: the energy component, network charges, renewable et policy levies et VAT — averaged over the standard band DC (2,500–5,000 kWh/year) et weighted to actual national consumption. Standing or fixed fees are typically bundled into the reported average, but your own bill depends on tariff et region.
How can I pay less for electricity in Europe?
Comparer tariffs every 12 months (default products are rarely cheapest), check eligibility for your country's social or vulnerable-customer tariff, use time-of-use rates for EVs, heat pumps et wet appliances, et consider rooftop solar where self-consumption is allowed. Your national regulator publishes official price comparisons — see each country page on this site for links.
Sources : Eurostat — Statistiques des prix de l'électricité (dataset nrg_pc_204, first half of 2026); Eurostat renewable energy statistics (2025 provisional); World Nuclear Association (2024); Ofgem (UK price cap, October 2026); ElCom/ELC et the Swiss Federal Office of Energy (Suisse). Estimates are informational — verify your own tariff with your supplier or national regulator.